Over-representation
Identify enriched pathways and biological processes with ORA. By comparing your data against known gene sets, discover the underlying mechanisms relevant to your research.
Pluto's Over-representation Analysis (ORA) tool enables researchers to conduct comprehensive pathway enrichment analyses, shedding light on the biological processes and molecular pathways significantly associated with their datasets. Utilizing well-curated gene set databases, such as KEGG, GO, and Reactome, ORA in Pluto helps to contextualize high-throughput data within the larger framework of biological systems. This analysis is indispensable for interpreting gene expression patterns, identifying biomarkers, or understanding disease mechanisms by revealing how groups of related genes are over-represented in your sample compared to what would be expected by chance. With Pluto, this complex analysis is simplified, allowing biologists to quickly move from raw data to meaningful biological insights, fostering deeper understandings of the data's implications for disease, development, and health. Ultimately, ORA serves as a powerful bridge between quantitative data and qualitative biological significance, empowering researchers to make informed hypotheses and pursue targeted follow-up studies.
Example

What can I do with this analysis?
- Pathway identification: You'll be able to look at all enriched biological pathways and explore their p-values and gene ratios to understand the significance and degree to which a pathway is enriched or over-represented in the groups you're comparing.
- Highlight gene sets of interest: How did your specific gene sets of interest change under a given condition? After running over-representation analysis, you'll be able to see if your gene sets of interest are enriched or over-represented in the groups you're comparing.
Suggested applications
- Molecular basis of disease: Perform over-representation analysis between healthy and disease samples to identify pathways associated with disease progression or response.
- Drug discovery: Perform over-representation analysis between samples treated with a drug and treated with a vehicle control to explore pathways affected by treatment.
- Biomarker signature identification: Perform over-representation analysis in two patient populations, such as responders vs non-responders, to identify signature pathways altered in the responder population.
Plot types & customizations
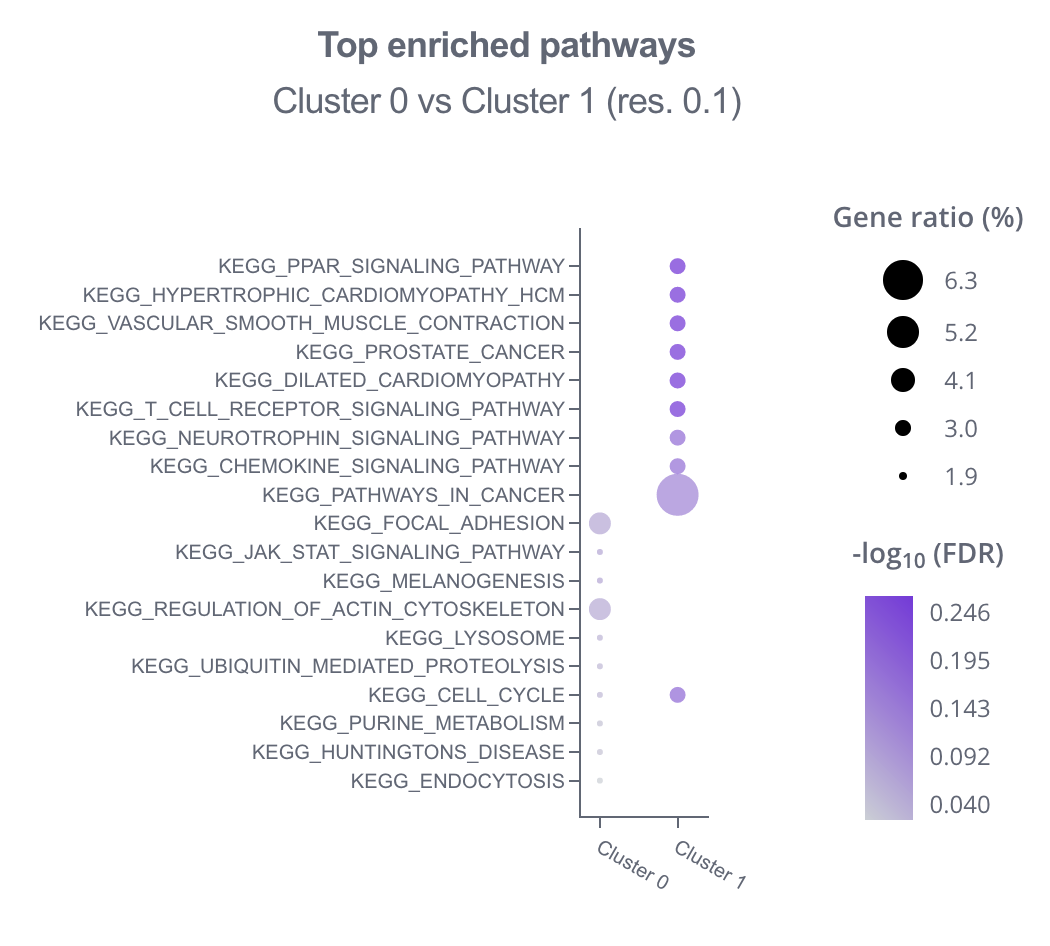
- Dot plot: Visualize the results of over-representation analysis using a dot plot, where gene sets are represented as dots colored by significance (-log10(FDR)) and sized by gene ratio (the fraction of differentially expressed genes found in a given gene set). You'll be able to customize properties such as:
- Transposing the x- and y-axis
- Selecting the maximum number of gene sets to display per group or overall
- Color gradient for dot representation

Additional resources
Ready to accelerate
your research?
See how Pluto can transform your multi-omics workflow.
Book a personalized demo