Longitudinal analysis
The component of time is a critical one in biological systems. Track changes longitudinally to examine temporal and continuous data, study developmental stages, treatment responses, disease progression, and more.
Pluto's Longitudinal Analysis tool is specifically designed to untangle the complexities of time-dependent data, providing biologists with the means to track changes across various temporal scales. Whether you're studying the effects of a new treatment over several months, observing disease progression, or monitoring developmental stages, Pluto makes it straightforward to visualize and analyze longitudinal data. This analysis supports the identification of significant time-related trends and patterns, offering invaluable insights into the dynamics of biological processes. By integrating longitudinal data analysis seamlessly into your research workflow, Pluto helps bridge the gap between raw data and meaningful, time-sensitive discoveries, enhancing your ability to draw conclusions and make decisions based on the temporal dynamics of your data.
Example

What can I do with this analysis?
- Identify temporal trends: You'll be able to analyze how biological measurements change over time within one or more samples or groups, allowing you to identify trends and patterns in your longitudinal data.
- Track changes in genes of interest: You can examine how your specific genes or biomarkers change over time across different experimental conditions, providing insights into dynamic biological processes.
- Assess treatment effects: After running longitudinal analysis, you'll be able to evaluate the effectiveness of treatments over time.
Suggested applications
- Treatment response monitoring: Track changes in biomarkers over time in response to a treatment regimen, helping to assess treatment efficacy and patient response variability.
- Disease progression: Analyze longitudinal data to understand how disease markers evolve over time, potentially identifying critical periods or markers predictive of disease progression.
- Developmental studies: Study changes in gene expression across developmental stages to uncover developmental trajectories or critical periods of growth and maturation.
Plot types & customizations
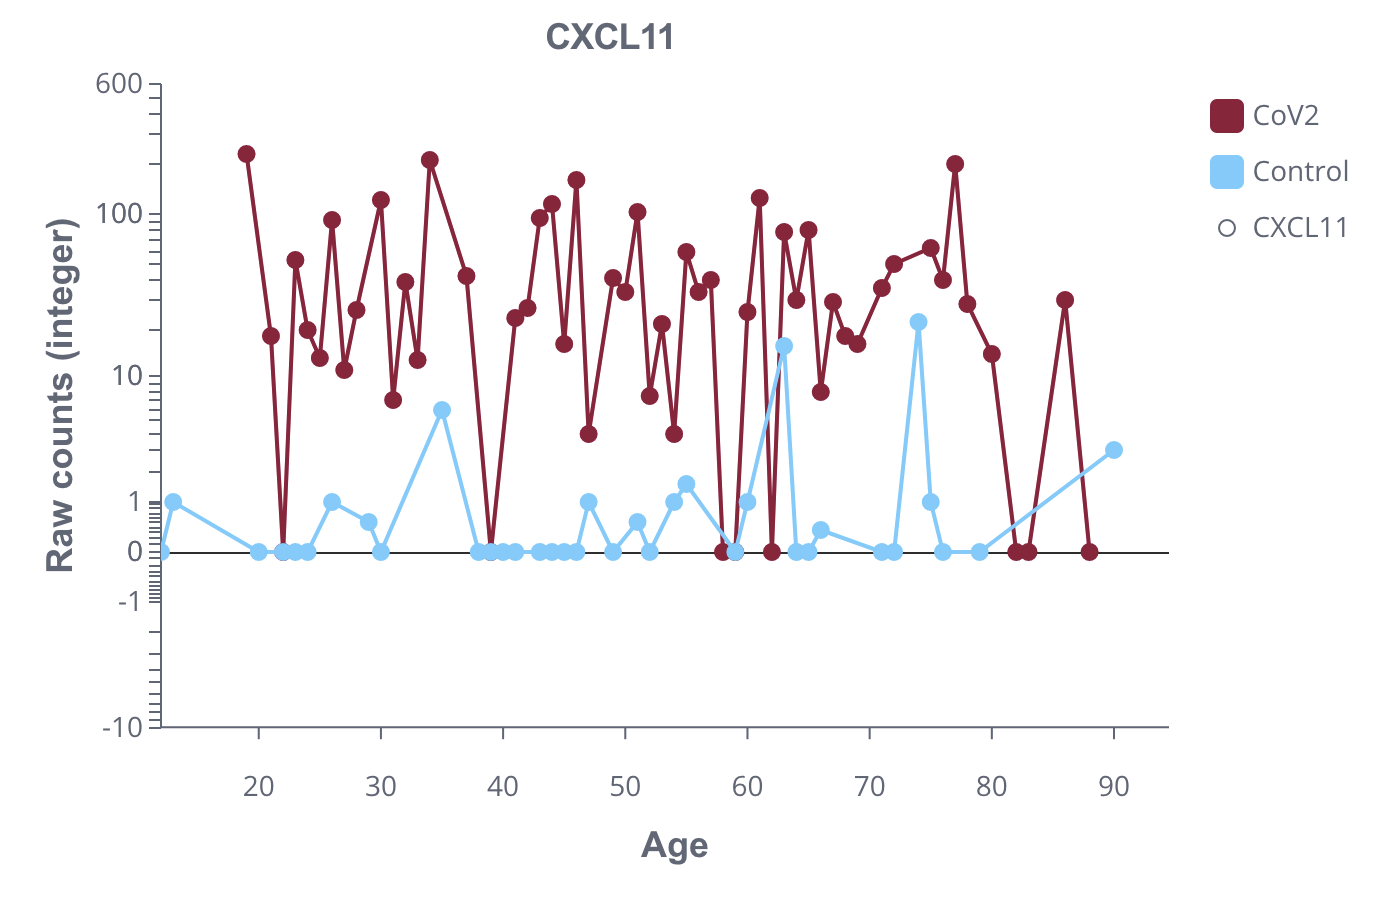
- Line plot: Visualize longitudinal data using line plots, where each line represents a sample or sample group. You'll be able to customize properties such as:
- y-axis scale (Symmetrical log or linear)
- Error bars
- Sample grouping
- Line colors

Additional resources
Ready to accelerate
your research?
See how Pluto can transform your multi-omics workflow.
Book a personalized demo