Functional
Uncover the biological functions and pathways associated with your data. Our functional analysis tools, including GO and KEGG, provide a comprehensive view of the biological context underlying your results.
Pluto's Functional Analysis tools offer an in-depth exploration of the biological context of your data, illuminating the functions and pathways that underpin your results. Utilizing established databases like Gene Ontology (GO) and Kyoto Encyclopedia of Genes and Genomes (KEGG), this analysis empowers researchers to contextualize their data within the vast landscape of biological processes. Whether identifying the molecular functions of gene sets, exploring metabolic pathways, or uncovering the cellular components involved in your study, Pluto's functional analysis provides a detailed understanding of how your data fits into broader biological mechanisms. This insight is invaluable for hypothesis generation, mechanism-of-action studies, and validating experimental findings, ensuring that researchers can confidently interpret their data and make informed decisions. With Pluto, uncovering the functional implications of your data becomes an intuitive and integral part of the discovery process.
Example

What can I do with this analysis?
- Functional annotation of genomic regions: You'll be able to annotate your peak regions, categorizing them as promoters, enhancers, or other regulatory elements.
Suggested applications
- Disease association: Annotate peak regions between healthy and disease samples to classify regulatory elements associated with disease states.
- Regulatory element identification: Use functional annotation analysis to categorize consensus peak regions identified across multiple cell lines.
- Molecular basis of disease: Annotate differentially bound/accessible regions identified between two groups, such as treated and untreated samples, to characterize regulatory elements associated with specific experimental conditions.
Plot types & customizations
-
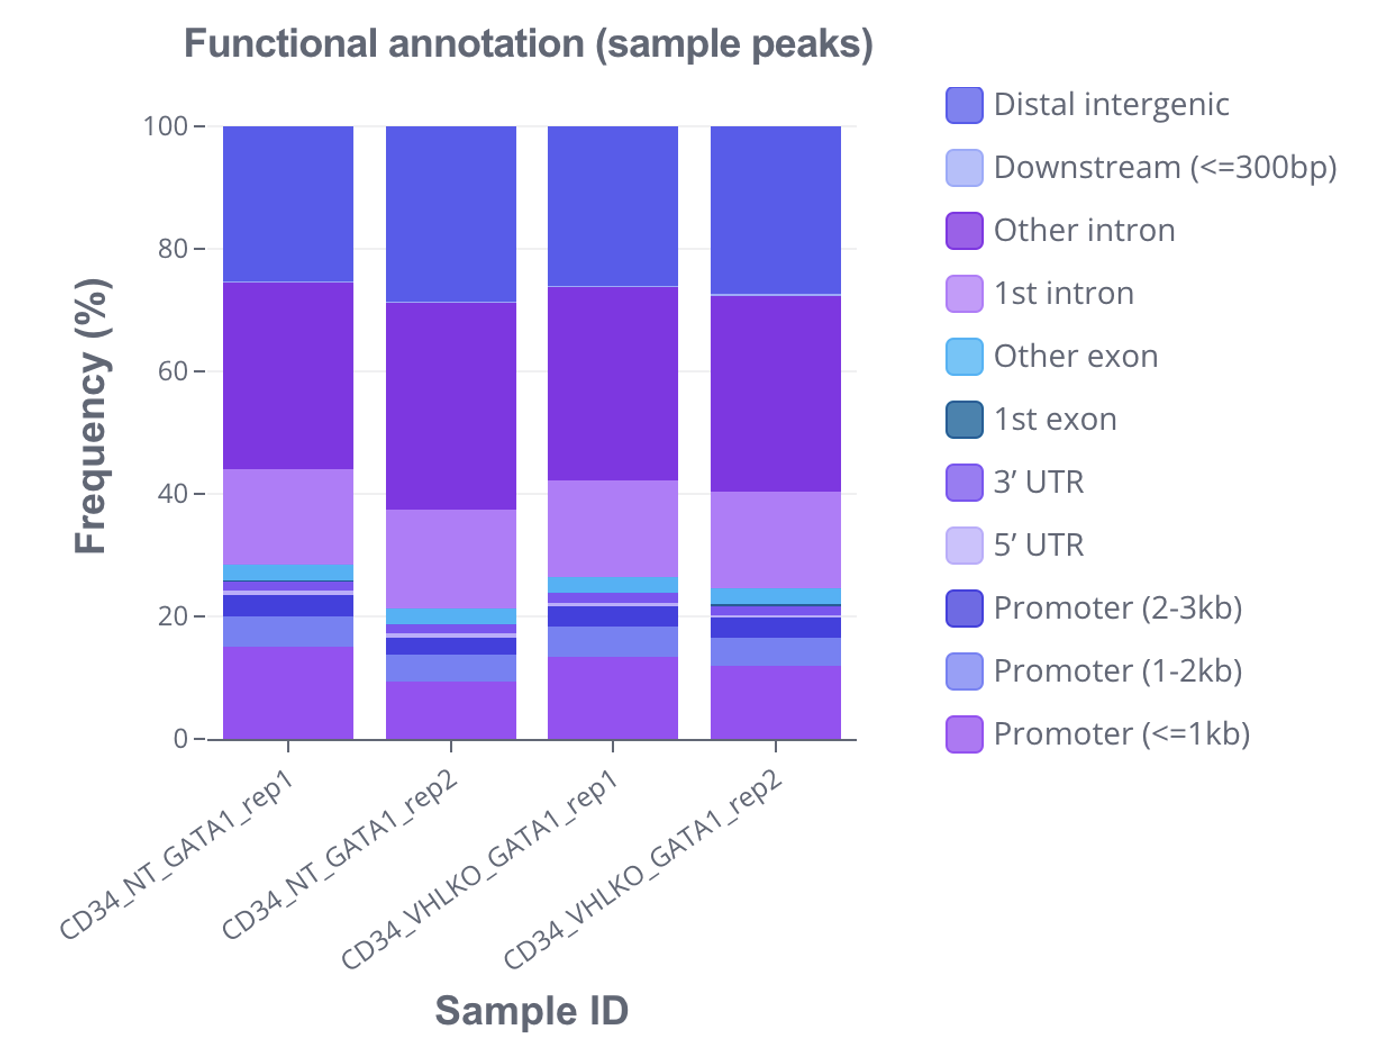
Stacked bar plot: A special kind of bar plot, stacked bar plots show functional annotations attributed to each peak set. Each bar represents a peak set, and segments within the bar represent frequencies of different annotations. You'll be able to customize properties such as:
- Transposing the x- and y-axis
- Annotation colors

-
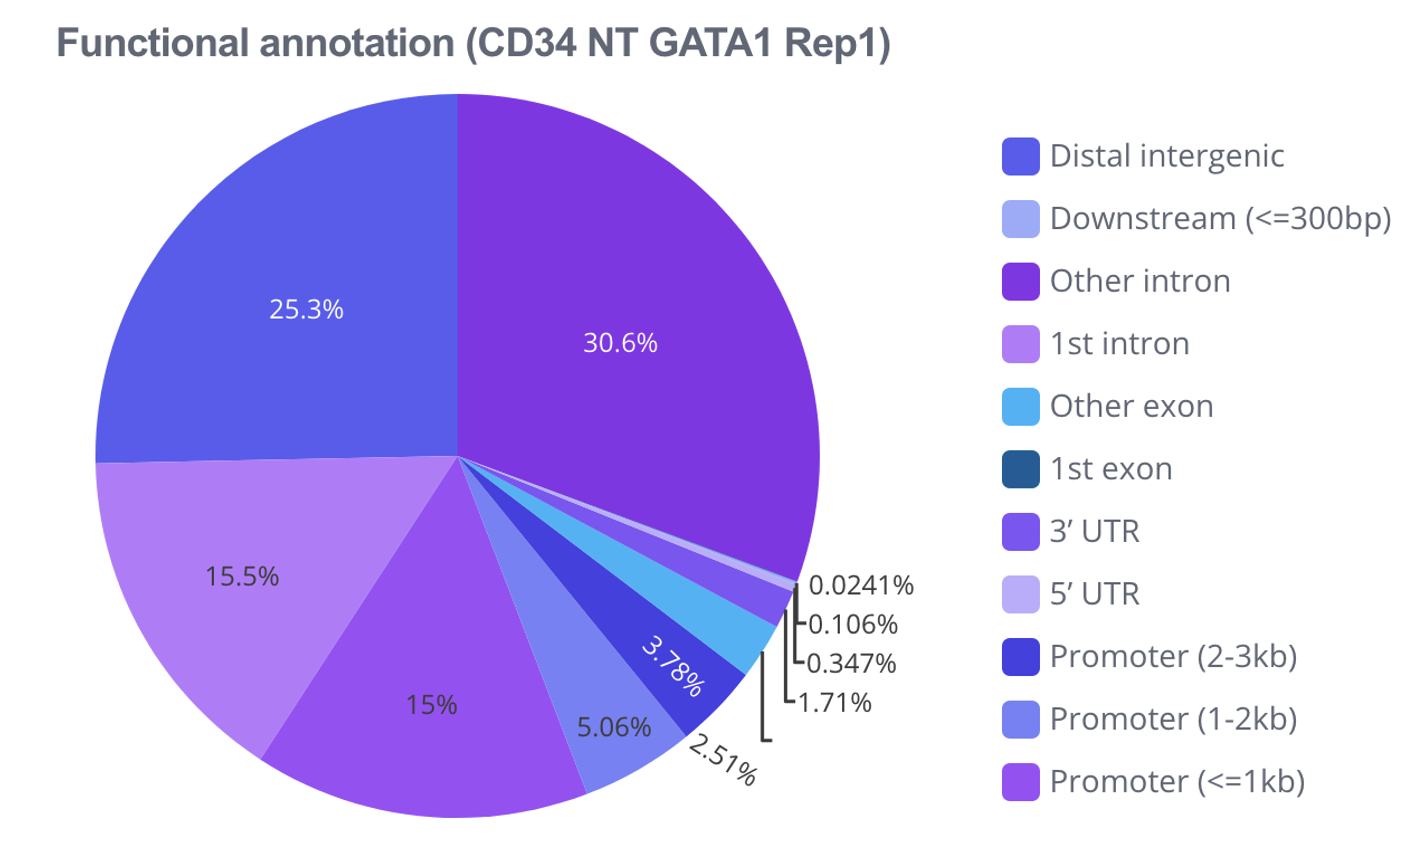
Pie chart: Visualize an individual peak set using a pie chart, where each slice represents a distinct annotation and its size corresponds to the annotation's frequency. You'll be able to customize properties such as:
- Selecting a peak set to visualize
- Showing percentages on the chart
- Annotation colors

Additional resources
Ready to accelerate
your research?
See how Pluto can transform your multi-omics workflow.
Book a personalized demo
