Differential analyses
Investigate genome-wide gene expression, binding, protein levels, and more using gold-standard computational biology algorithms. Flexibly compare conditions, treatments, and any other variables relevant to your study.
Differential Analysis in Pluto Bio utilizes industry-standard algorithms to provide deep insights into gene expression, protein levels, and more. This tool empowers researchers to compare various conditions or treatments efficiently, highlighting significant biological differences. With Pluto, uncovering the molecular underpinnings of complex biological processes has never been more accessible, providing a robust foundation for further investigation and discovery.
Example
What can I do with this analysis?
- DEG identification: You'll be able to look at all differentially expressed genes (DEGs) and explore their p-values and fold change values to understand the significance and magnitude of their changes under the conditions you're comparing.
- Highlight genes of interest: How did your specific genes of interest change under a given condition? After running differential expression analysis, you'll be able to see if your genes of interest increased or decreased in expression.
- Exploration of altered pathways: After running differential expression analysis, you'll unlock some additional downstream analyses including pathway analysis, which will help you understand what pathways are most affected amongst all of the DEGs.
Suggested applications
- Molecular basis of disease: Compare disease vs healthy samples to identify genes with altered expression in the disease state.
- Drug discovery: Compare samples from cells that were treated with a drug vs cells treated with a vehicle control to explore genome-wide expression changes resulting from treatment.
- Biomarker discovery: Compare two patient populations such as responders vs non-responders to identify a signature of genes altered uniquely in the responder population.
Plot types & customizations
-
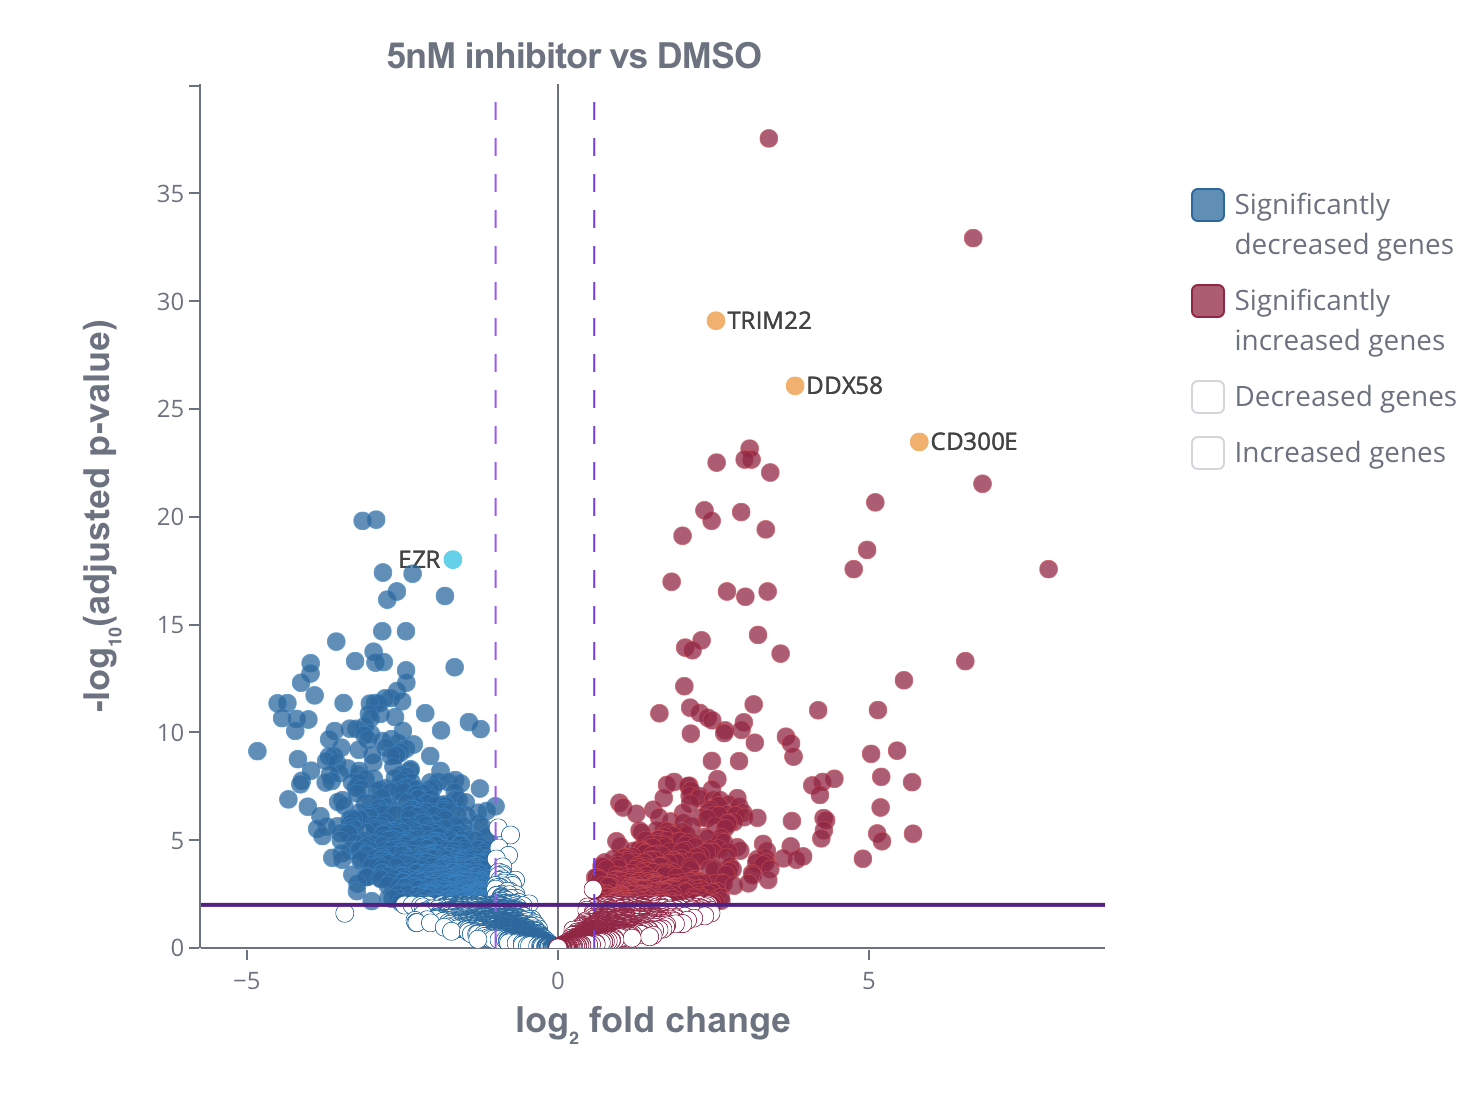
Volcano plot: A special kind of scatter plot, volcano plots show the magnitude of gene expression change (log2 fold change) on the x-axis and the significance (-log10(p-val)) on the y-axis. You'll be able to customize properties such as:
- Highlighting specific genes by name or with a lasso tool
- Significant and non-significant point colors (background & outline)
- Log2 fold change threshold lines (color, width, stroke type)
- p-value threshold line (color, width, stroke type)

-
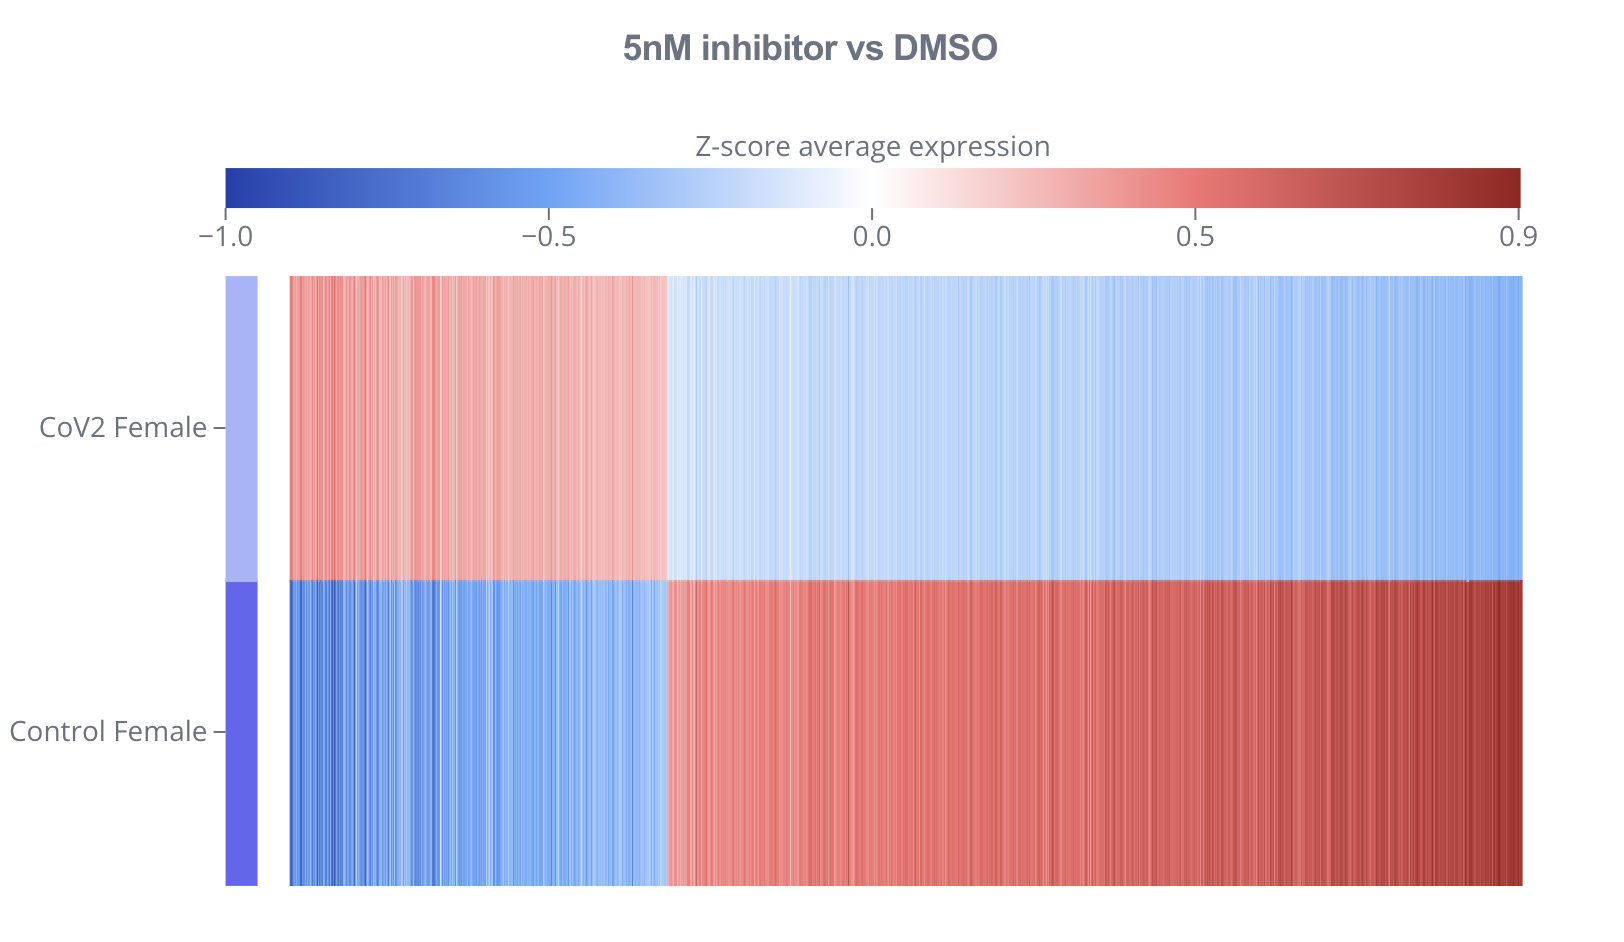
Heatmap: Visualize either the average or median log2 fold change gene expression in the two groups you're comparing with a heatmap. You'll be able to customize properties such as:
- p-value threshold
- Heatmap color theme
- Group colors

Additional resources
Ready to accelerate
your research?
See how Pluto can transform your multi-omics workflow.
Book a personalized demo