
Happy Spring from the whole Pluto team!
We’re excited to share a look at some of the latest product updates we’ve been working on, and give you a sneak peek into new features. Here’s the latest:
Flexible plot layouts
Flexible page layouts in Pluto help you showcase every new result to its fullest potential. You can create half-width plots, and make them full-width by opening the Edit Plot menu, checking the Show full-width box in the sidebar, and clicking View Changes.
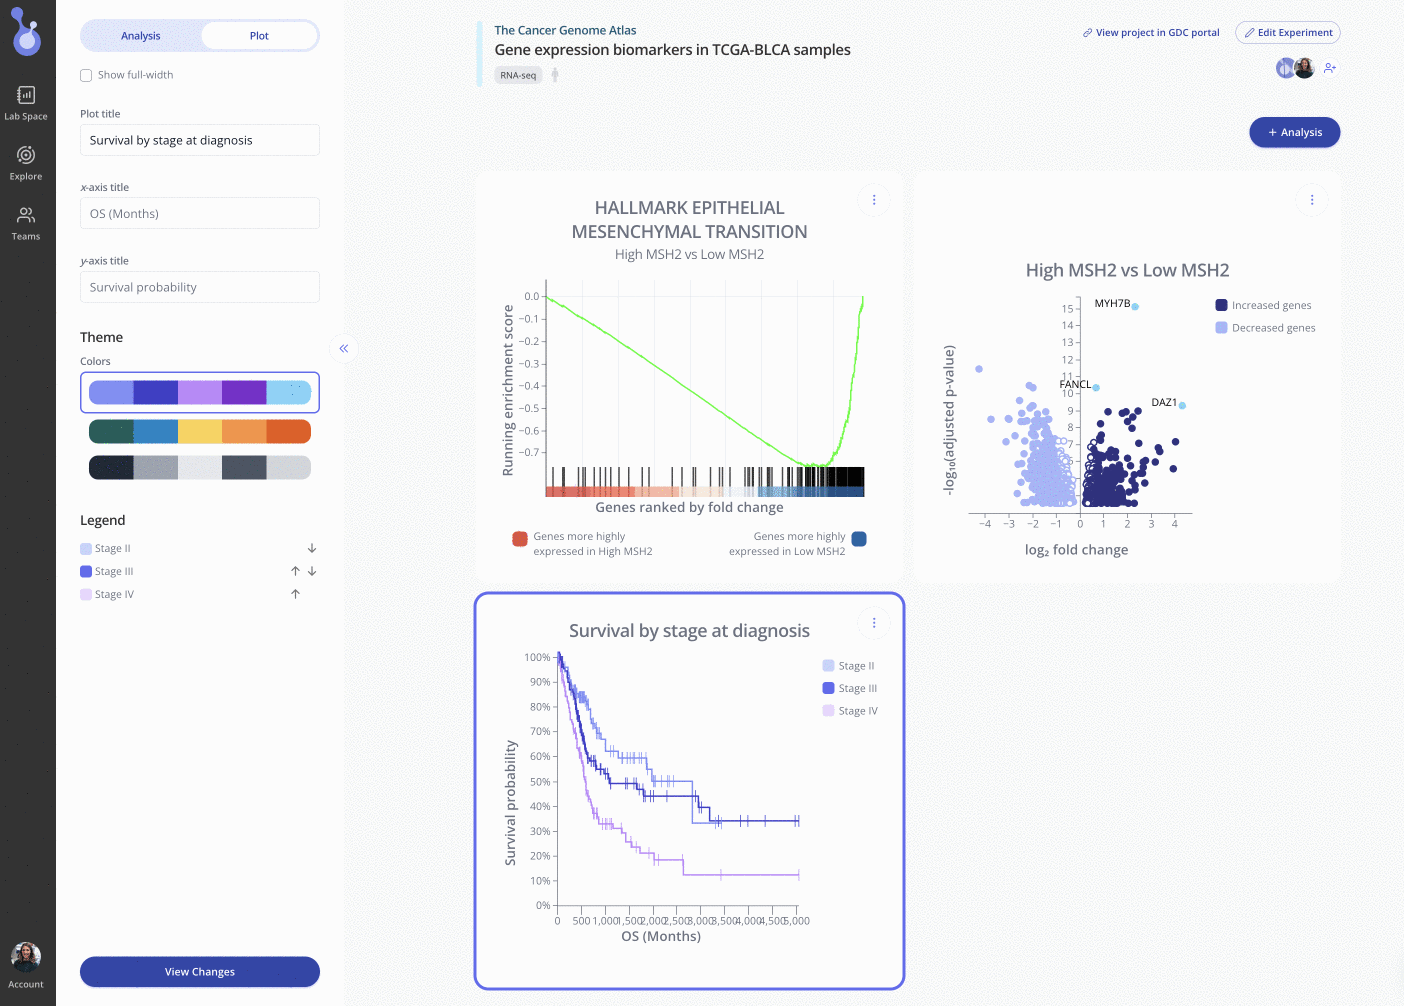
Click and drag any plot to move it around the page, assembling your results in the way that’s most relevant to your experiment.
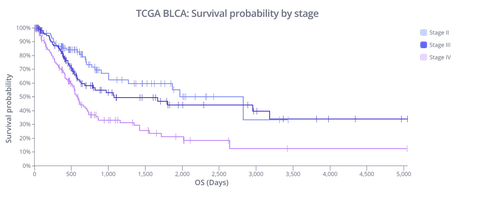
New analysis type: Time-to-event or survival analysis
For clinical studies measuring time to an event of interest, you can now perform time-to-event or survival analysis in Pluto. Contact us to have this analysis type enabled in your Lab Space! For more information, check out our guide to performing survival analysis in Pluto.
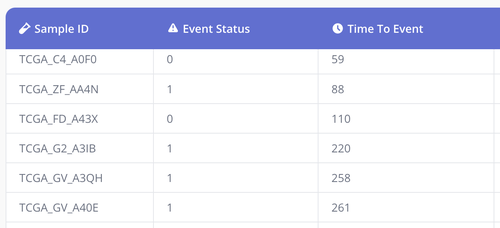
Include 2 new columns in your sample data representing 1) the binary status of an event and 2) the time to the event, and create interactive Kaplan-Meier curves with a few clicks.
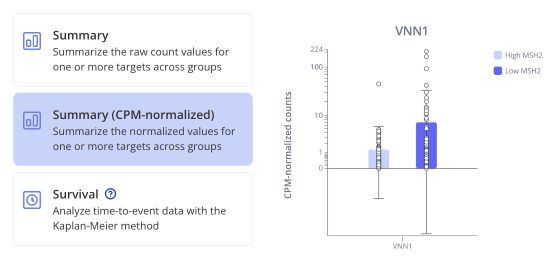
Normalization for count data
Sequencing-based experiments can be affected by uneven sequencing depth across samples. Use the new Summary (CPM-normalized) option to perform counts per million (CPM) normalization on your raw count data and visualize the results with barplots, boxplots, or heatmaps. Learn more about CPM normalization in Pluto.
Plus, in case you missed it
Capture even more results with images
Upload images to provide even richer context to your experiment. Record relevant methods and tag targets present in the image.
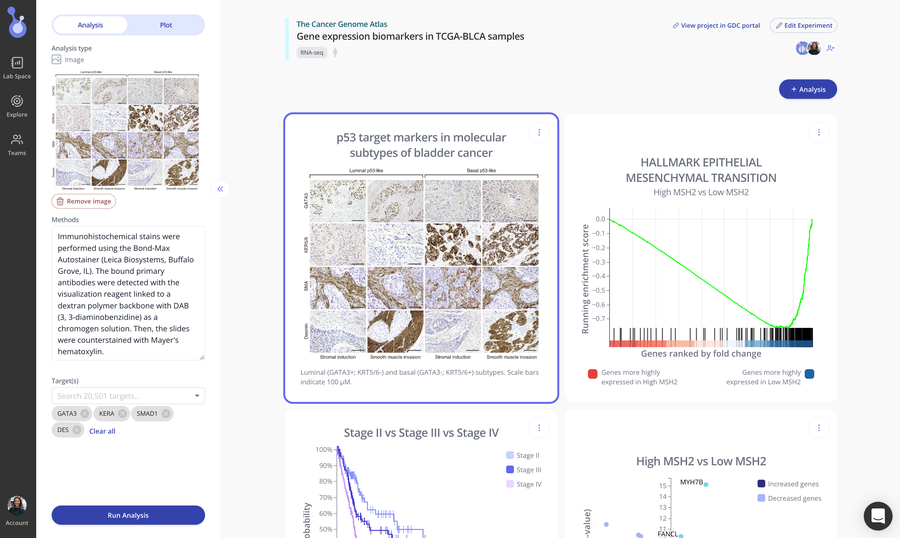
Don’t do imaging on a microscope? Include images of Western blots, chemical structures, and even graphical abstracts or any other diagrams relevant to your experiment. The possibilities are endless!
Check out some of our favorite creative use-cases for the Pluto image widget.
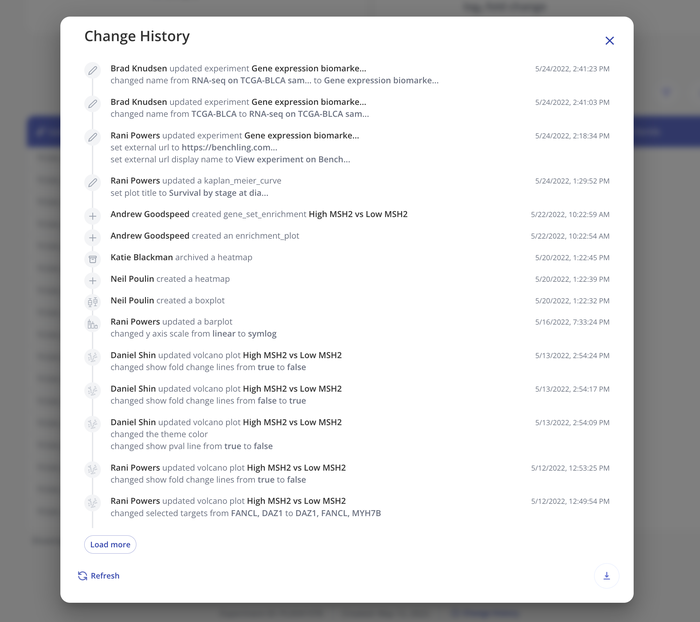
Track changes to your experiments and plots
While some features naturally capture the spotlight, some make their important impact behind the scenes. With the Change History link in the footer of every experiment in Pluto, you can review the full list of modifications made to any experiment, from creation to final results, for end-to-end traceability into how results were generated.
Stay tuned!
We’re launching even more highly requested features this month. Keep an eye out for the next product highlight, where we’ll showcase how interactive Pluto plots can be embedded into other apps your team already uses.
Thanks for reading! Say hello any time at hello@pluto.bio - we’d love to hear your thoughts on the features we’re highlighting this month.