
An IGV (Integrative Genomics Viewer) plot is a powerful visualization tool that allows researchers to view and analyze genomic data in a highly interactive and customizable manner. IGV plots can be utilized in a variety of applications, from basic research to clinical genomics, to identify and interpret genomic variations, gene expression patterns, epigenetic modifications, and other genomic features.
In this blog post, we will discuss what an IGV plot is, its features, and how it can be used in genomic research.
What is an IGV plot?
An IGV plot is a software tool that allows researchers to visualize and explore genomic data in a graphical format. IGV plots can be generated using a wide range of genomic data types, including next-generation sequencing data, microarray data, and other high-throughput data.
Features of an IGV plot
An IGV plot has many features that make it a powerful tool for genomic data analysis. These include:
-
Interactive visualization: IGV plots allow users to interactively visualize genomic data at various levels of resolution, from whole chromosomes down to individual nucleotides.
-
Customizable display: Users can customize the display of genomic data in IGV plots, such as changing the color, track height, and track order. This allows researchers to compare multiple data sets side-by-side, which is particularly useful for identifying genomic variations and gene expression patterns.
-
Integration of public data sets: IGV plots allow users to integrate public data sets, such as gene annotations, genomic sequence data, and epigenetic modifications. This integration enables users to examine the context of genomic features and better understand their functional roles.
-
Batch processing: IGV plots can be used to generate large numbers of plots in batch mode, which is particularly useful for analyzing large genomic data sets.
Utilizing IGV plots in genomic research
IGV plots can be used in a wide range of genomic research applications. Some of these include:
-
Identifying genomic variations: IGV plots can be used to identify genomic variations, such as single nucleotide polymorphisms (SNPs), insertions, and deletions. Additionally, strand information for paired-end sequences is also displayed on IGV plots, allowing strand assignment for variations. By visualizing these variations in the context of genomic features, researchers can better understand their potential functional effects.
-
Exploring gene expression patterns: IGV plots can be used to explore gene expression patterns, such as alternative splicing and differential gene expression. By examining gene expression in the context of genomic features, researchers can better understand the regulatory mechanisms that govern gene expression.
-
Analyzing epigenetic modifications: IGV plots can be used to analyze epigenetic modifications, such as DNA methylation and histone modifications. By visualizing these modifications in the context of genomic features, researchers can better understand the role they play in gene regulation and disease development.
-
Clinical genomics: IGV plots can be used in clinical genomics to identify genomic variations that may be associated with disease. By visualizing genomic data from patients, researchers and clinicians can identify potential disease-causing variations and develop targeted therapies.
How to create an IGV plot
To create an IGV (Integrative Genomics Viewer) plot, you will need to follow these steps:
-
Download and install the IGV software: You can download the IGV software from the official website at https://software.broadinstitute.org/software/igv/download. Follow the instructions to install the software on your computer.
-
Load your data: To create an IGV plot, you will need to load your data into the IGV software. IGV supports a wide range of data types, including BAM, BED, VCF, and wiggle files. To load your data, go to the "File" menu and select "Load from File" or "Load from URL," depending on where your data is stored. Your file should be indexed, which can be done with samtools.
-
Set your preferences: Once your data is loaded, you can set your preferences for how the data will be displayed in the IGV plot. This includes options such as track height, color, and track order. You can also customize the reference genome and annotation tracks to provide more context for your data.
-
Navigate and zoom: Use the navigation tools to explore your data, including the scroll bar, zoom in/out buttons, and search box. You can zoom in and out to different levels of resolution, from whole chromosomes down to individual nucleotides. You can also search by chromosome and loci, or even gene symbols.
-
Add additional tracks: You can add additional tracks to your IGV plot to provide more context for your data. This can include gene annotation tracks, epigenetic modification tracks, and other public data sets.
-
Save and export your IGV plot: Once you have created your IGV plot, you can save it in a variety of formats, including PNG, PDF, and SVG. You can also export your IGV plot data in various formats, including BED, VCF, and TDF.
In summary, creating an IGV plot involves loading your data into the IGV software, setting your preferences for display, navigating and zooming to explore your data, adding additional tracks, and then saving or exporting your plot. The IGV software is highly customizable and versatile, making it a powerful tool for genomic data analysis.
Methods to create the data needed to utilize an IGV plot
There are several methods to create the data used in an IGV (Integrative Genomics Viewer) plot, depending on the type of genomic data you are analyzing. Here are some common methods to generate data for an IGV plot:
-
Sequencing data: To create IGV plots of sequencing data, such as RNA-seq, ChIP-seq, or whole-genome sequencing, you first need to generate sequencing data. This involves sample preparation, sequencing, and data processing, such as alignment to a reference genome and calling variants. Tools like Bowtie, BWA, STAR, and GATK can be used for these steps. Additionally, remember to index the file, which is needed for loading the genome into IGV. Once the sequencing data is processed, it can be loaded into IGV as a BAM file, which contains aligned reads.
-
Microarray data: To create IGV plots of microarray data, such as gene expression or DNA copy number variation, you need to first generate microarray data using a microarray platform, such as Affymetrix or Illumina. The data can be pre-processed using normalization methods, such as Robust Multi-array Average (RMA) or GeneChip Robust Multi-array Analysis (GCRMA). The processed data can be loaded into IGV as a wiggle file or bed file.
-
Epigenetic data: To create IGV plots of epigenetic data, such as DNA methylation or histone modifications, you first need to generate the data using techniques like bisulfite sequencing or ChIP-seq. The data can be pre-processed and aligned to a reference genome, and then loaded into IGV as a bedgraph file or bigwig file.
-
Variant data: To create IGV plots of variant data, such as single nucleotide polymorphisms (SNPs), insertions, and deletions, you need to first identify and annotate variants in your genomic data. This can be done using tools like GATK, SAMtools, or VarScan. The variant data can be loaded into IGV as a VCF (Variant Call Format) file.
-
Annotation data: To create IGV plots with gene annotations, repeat elements, or other features, you can download public data sets from sources such as UCSC Genome Browser, Ensembl, or RefSeq. These data sets can be loaded into IGV as BED files, GFF files, or bigBed files.
In summary, creating data for an IGV plot involves generating and pre-processing genomic data using techniques specific to the type of data, and then saving the data in a compatible file format that can be loaded into IGV. The data can be aligned to a reference genome, annotated with gene features, or processed to detect variants or epigenetic modifications. The resulting data can be visualized in IGV using customizable tracks that provide a powerful and interactive tool for genomic data analysis.
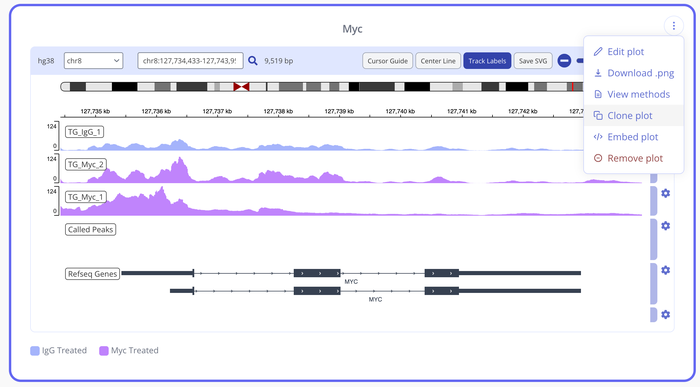
Generating an IGV Plot in Pluto
Creating an IGV plot within the Pluto platform is easy and can be done simply by uploading raw fastq data. To read more about how to do this, visit our help article here.
Conclusion
In this blog post, we discussed the fundamentals of IGV (Integrative Genomics Viewer) plots, a powerful visualization tool used to analyze genomic data. We learned that IGV plots are highly customizable and interactive, allowing users to visualize and explore genomic data at various levels of resolution. We also discussed how IGV plots can be utilized in various genomic research applications, such as identifying genomic variations, exploring gene expression patterns, analyzing epigenetic modifications, and clinical genomics.
We then delved into the methods for creating the data used in IGV plots, which depend on the type of genomic data being analyzed. We described the steps for creating IGV plots for sequencing data, microarray data, epigenetic data, variant data, and annotation data, which typically involve generating or pre-processing genomic data using techniques specific to the type of data. We also highlighted several tools and platforms used for these steps, such as Bowtie, BWA, GATK, SAMtools, and UCSC Genome Browser.
In conclusion, understanding the methods for creating data used in IGV plots is essential for researchers working with genomic data. By following the steps outlined in this blog post, researchers can generate high-quality genomic data for IGV plots and use this powerful tool to gain insights into the functional roles of genomic variations, gene expression patterns, epigenetic modifications, and other genomic features.