
Overview
In order to transform RNA sequencing data into meaningful insights, sequencing reads are mapped to transcripts and/or genes. One obstacle in this process of gene/transcript quantification is how to handle reads that map to multiple genes or isoforms (i.e. reads that do not map uniquely). The problem is further complicated by the variability experimental design across RNA-seq experiments (e.g. sequencing depth, read length, library type).
RNA-seq by Expectation-Maximization (RSEM) is a now well-established algorithm that was developed to address this challenge: estimating gene and isoform expression levels from RNA-seq data1.
About the RSEM algorithm
Initially published in its current form in 2011, RSEM is a software package for quantifying gene and isoform abundances from single-end or paired-end RNA-seq data. RSEM outputs abundance estimates and 95% credibility intervals, and can be used with or without a reference genome1.
The RSEM algorithm consists of two general steps:
rsem-prepare-reference - generates a set of reference transcript sequences for use by the second RSEM step
rsem-calculate-expression - aligns RNA-seq reads to the reference transcripts and uses the alignments to estimate abundances and their credibility intervals
RSEM outputs both transcript-level and a gene-level count estimates.
Using RSEM to perform gene & transcript abundance quantification on RNA-seq data
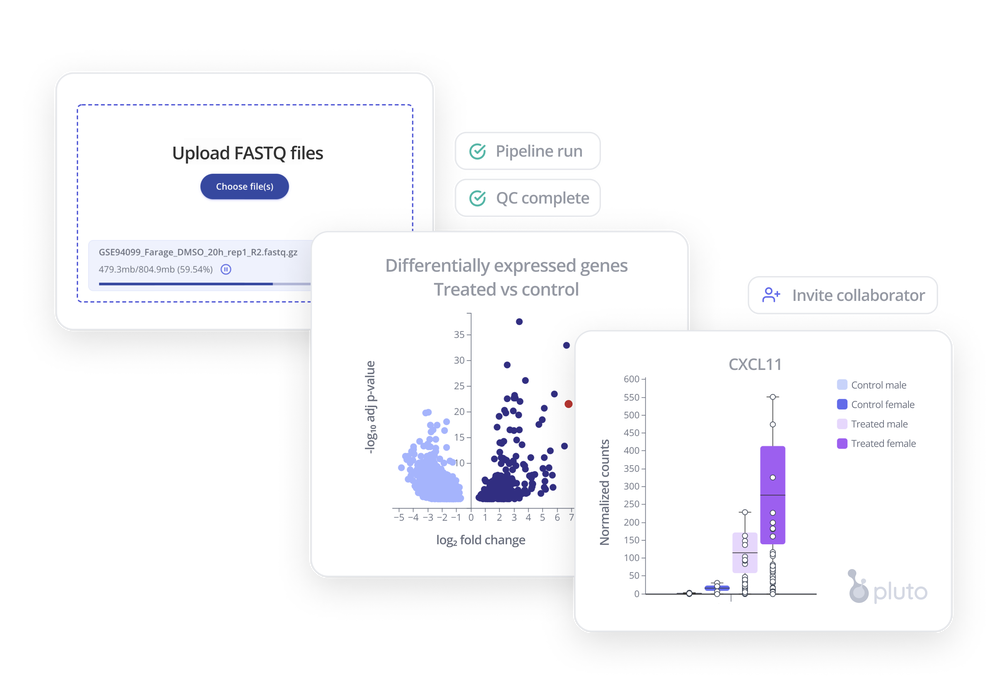
After you've prepared your RNA-seq samples and sent them off for sequencing, you'll receive FASTQ files. These large, raw sequencing files need to be processed through a multi-step process in order to ultimately generate raw counts, which will be used for downstream analysis.
RSEM is one of these steps. The package can be run by itself, but is commonly one of several tools that are combined to make an RNA-seq pipeline. A typical pipeline for RNA-seq data includes the following steps:
- Quality control (QC) - FASTQC and MultiQC
- Adapter trimming - TrimGalore!
- Alignment - STAR
- Quantification - RSEM
- Quality filter, sort and index alignments - samtools
- Mark (and optionally remove) duplicate reads - picard
- Optionally create bigWig files - bedGraphToBigWig
- Additional QC - RSeQC, Preseq
Running the above tools yourself will require compute infrastructure and advanced coding. Expect the RNA-seq pipeline to run in about 1-5 hours per sample depending on your compute resources and parallelization approach.
Want to get to insights faster? With Pluto, you can run an end-to-end RNA-seq pipeline in your browser, with no infrastructure or coding required. Learn more with a live, 15-minute demo.
Analyses and visualization
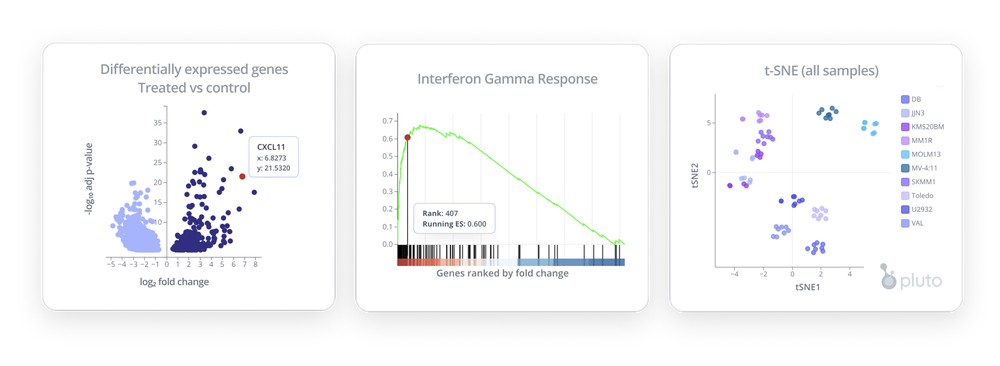
After performing quantification with RSEM, there are a wide variety of analyses and visualizations you can use to explore your RNA-seq data. Here are a few ideas to get you started!
- Differential expression analysis - Identify genome-wide gene expression changes between two groups
- Pathway analyses (GSEA) - Identify coordinated, pathway-level changes
- Dimensionality reduction analyses (PCA, UMAP, t-SNE) - Visualize how samples cluster on a scatterplot based on genome-wide expression
- Summary analysis - Plot raw or normalized counts on bar plots, boxplots, line plots
Ready to analyze some RNA-seq?
Thanks for reading this brief post on RSEM, a transcript abundance quantification tool for RNA-seq!
Did you know? Your entire team can process RNA-seq data with RSEM and other pipeline tools, plus create the interactive analyses and visualizations shown above, all in your browser with Pluto.
To learn more and take Pluto for a spin, contact us to get started today.
References & additional resources
- Li, B., Dewey, C.N. RSEM: accurate transcript quantification from RNA-Seq data with or without a reference genome. BMC Bioinformatics 12, 323 (2011). https://doi.org/10.1186/1471-2105-12-323