Are you hearing about CUT&RUN but not sure where to get started? Maybe you're already running CUT&RUN experiments but want to better understand the assay and downstream analysis steps. This post will help biologists and bioinformaticists understand the foundations for designing a CUT&RUN experiment, and analyzing your data to maximize novel insight gained.
Background: A new assay is born
Since the early 2000s, measuring binding sites of DNA-associated proteins has widely been done using ChIP-seq1, a genome-wide epigenomics profiling assay. In 2017, Peter Skene and Steven Henikoff published a paper introducting a new assay, CUT&RUN2. In the own authors' words:
CUT&RUN is simple to perform and is inherently robust, with extremely low backgrounds requiring only ~1/10th the sequencing depth as ChIP, making CUT&RUN especially cost-effective for transcription factor and chromatin profiling.
In a nutshell - CUT&RUN Method
Cleavage Under Targets and Release Using Nuclease
- Identifies regions in the genome where a protein of interest, such as a transcription factor, may be binding to a region within DNA
- Regions of DNA that are sequenced are indicative of active binding of the target protein (more on target proteins below)
- Sequences can be used to identify enriched motifs, or breakdown of the genomic binding locations (TSS, coding, intronic, promoter, etc)
- Peaks help us visualize changes that occur in the epigenetic landscape of chromatin remodeling that allowed for chromatin to be open and available for binding by the target protein to DNA
ChIP-seq, CUT&RUN, and CUT&Tag
Although all methods measure protein-DNA interactions with the use of an antibody, there are some key pros and cons to consider when selecting an assay to test your hypothesis.
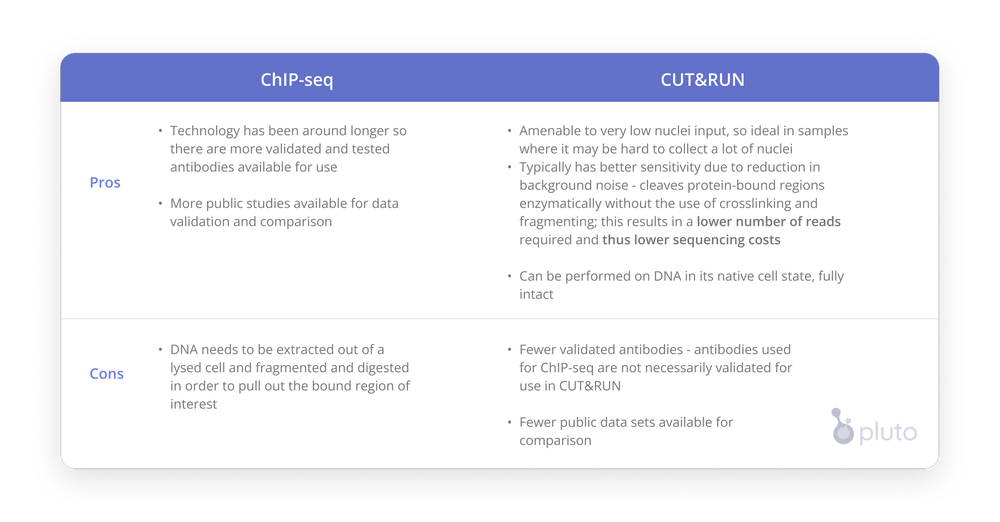
CUT&Tag was invented in 2019 and addresses a similar question as CUT&RUN with different wet lab sample preparation - CUT&Tag utilizes the same tagmentation enzyme, Tn5, as ATAC-seq to facilitate the cutting of protein-bound DNA fragments3.
What do I need for CUT&RUN?
Reagents included in CUT&RUN kits
Expand each section to learn more
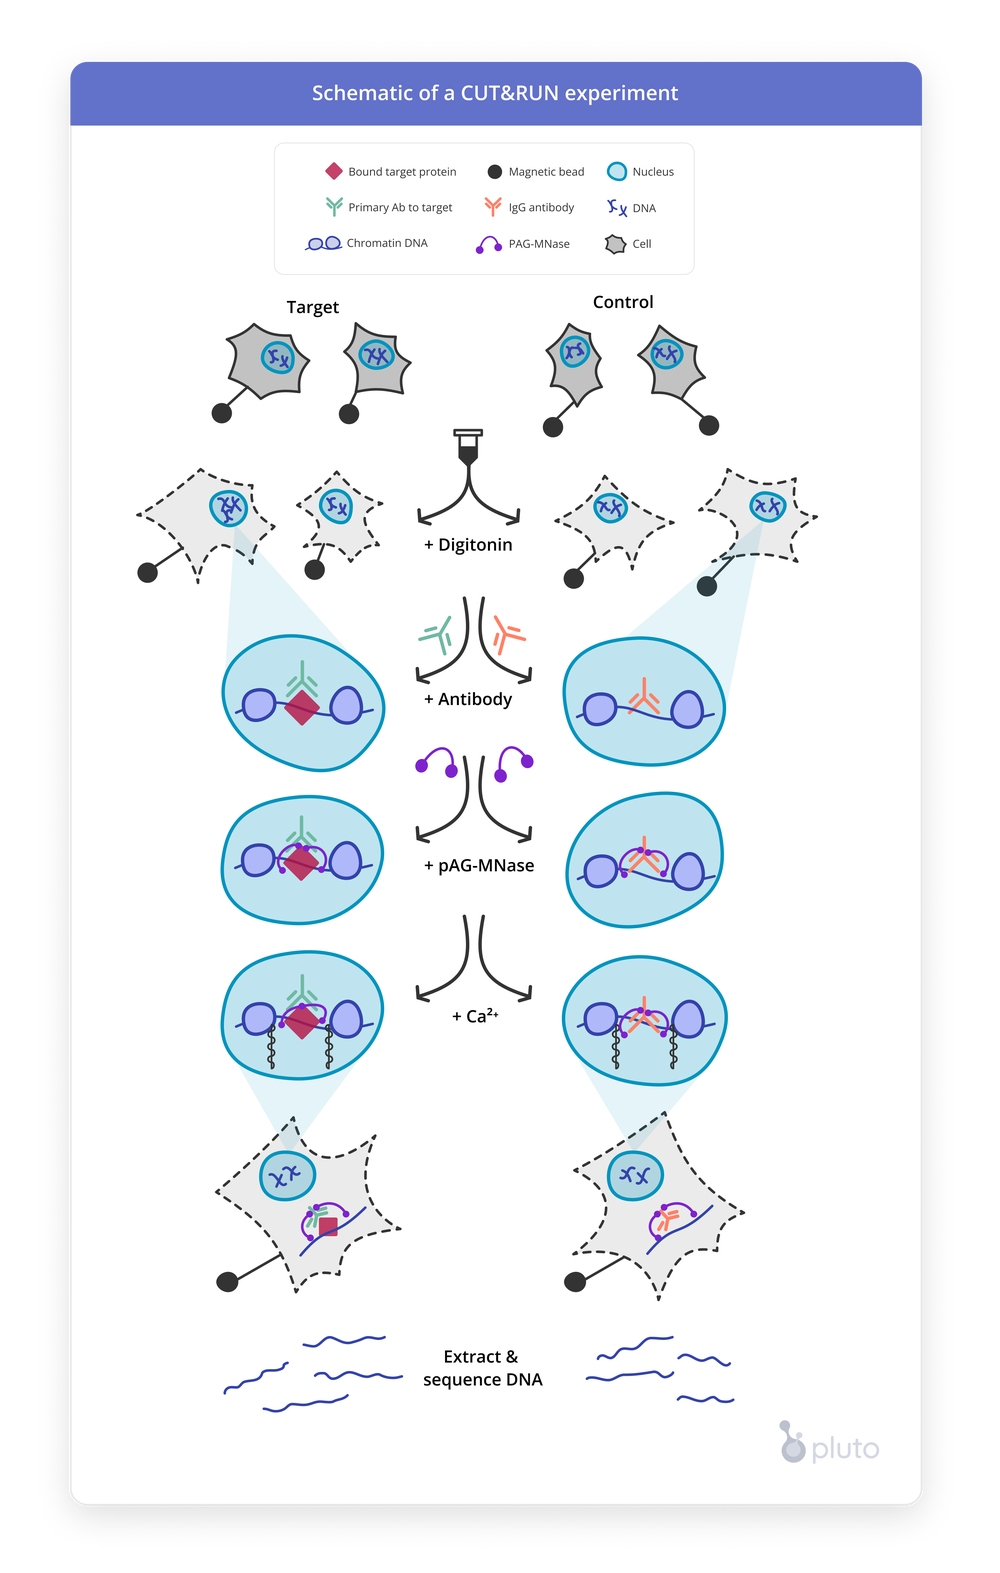
pAG-MNase
The enzyme (nuclease) that cuts DNA. The protein A gets tethered/bound to the antibody and wherever the antibody binds is where the enzyme cuts once activated. In CUT&Tag, this is replaced by the Tn5 transposase.Ca2++ buffer
The addition of calcium activates the pAG-MNase enzyme to begin cutting DNA. We later stop the enzymatic activity so it doesn't over-cut by adding a stop buffer to deactivate the enzymatic activity.IgG antibody (negative / input control)
Critical in CUT&RUN experiments, the input control is required for background noise estimation (i.e. non-specific artifact binding unrelated to your biological condition of interest).H3K4me3 (positive control)
Especially in the case where few peaks are called and we observe low signal-to-noise ratio, it is critical to know whether the experiment itself worked properly. Adding H3K4me3 to one or more samples provides a positive control, because it should always show lots of open regions with binding. If not, then we may conclude that the entire experiment was not successful (e.g. enzyme is bad, antibody problem, wet-lab technical difficulties, etc)Digitonin
Makes cell membranes permeable so antibodies and enzymes can penetrate the cell membrane and migrate into the nucleus. Bound cut reads are small enough to exit the cell membrane. Anything that is not cut (large chromatin regions) remain stuck in the nucleus due to their size. Therefore, when the sample is centrifuged, the cell membrane and its nucleus will be found in the pellet whereas the small DNA fragments cut by the enzyme will be in the supernatant, which is extracted, the protein is released from the DNA and purified before sequencing. This is a key reason for CUT&RUN's high signal-to-noise ratio compared to ChIP-seq.Magnetic beads
Stabilize the cells to the magnetic plate to prevent cell loss during the experiment. This can sometimes cause an artificially activated immune response, so use nuclei for immune studies to bypass the cell membrane immobilization step.E. coli spike-in (optional)
You may optionally include a spike-in control, DNA from an organism far different from the one being assayed that can be used to normalize consensus peak counts (more on this below). Most kits use E. coli as a control, but note that this isn't a suitable spike-in if your host is a bacterial genome.A note on spike-in controls for normalization: Spike-in controls can be added to each sample in order to normalize your data for differences in sequencing depth as long as they are used appropriately. It is currently debated in the field whether there is an added benefit to using spike-ins for CUT&RUN because, unlike ChIP-seq, CUT&RUN already has a high signal-to-noise ratio. Spike-in controls require precise preparation in order to be useful - if misapplied, they may actually add noise to your experiment.
Other materials
Antibodies - You'll need to purchase the primary antibody that targets your protein of interest
Cells or nuclei - Your samples!
Designing your CUT&RUN experiment
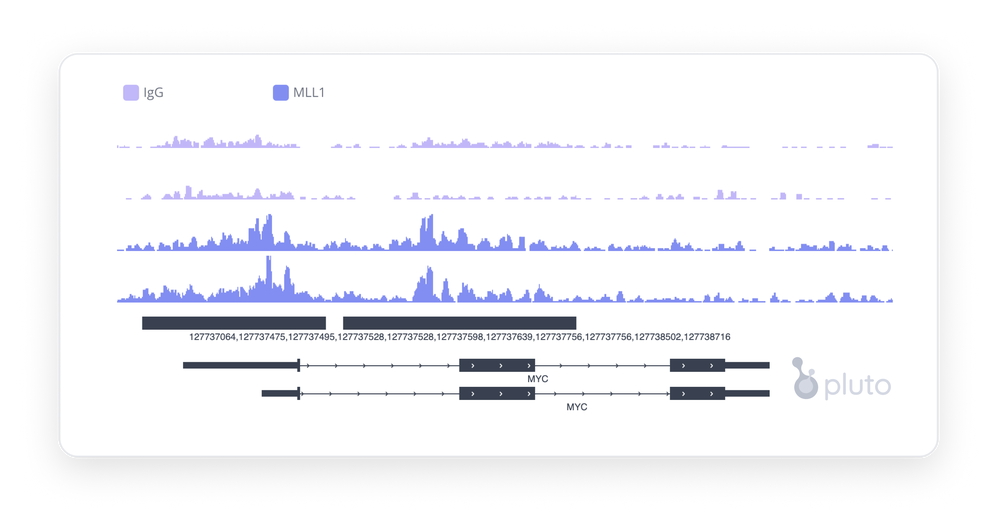
Ideally, CUT&RUN experiments should include a samples with H3K4me3 antibody as a positive control, in addition to an appropriately matched IgG negative control sample for each of your “target” samples. Target samples use an antibody that is typically either a histone marker (e.g. H3K4me3) or an antibody to a transcription factor (e.g. MLL), co-factor, or other protein of interest.
Control samples are a critical component for designing a good CUT&RUN experiment with interpretable results. Unlike other commonly used next-generation sequencing (NGS) experiments, NGS experiments that utilize peak calling algorithms for surveying antibody binding such as CUT&RUN, CUT&TAG, and ChIP-seq require the use of a good input control sample.
More about interpreting controls
The input control for CUT&RUN and CUT&TAG experiments is usually an antibody to IgG. The pAG-MNase nuclease used in CUT&RUN experiments has a high binding affinity to most commonly used organism IgG antibodies with the exception of mouse. Since pAG-MNase is a nuclease, it is still able to cut DNA non-specifically in the absence of the target antibody when regions are open enough for the pAG-MNase to fit between regions of condensed chromatin.
We identify these "non-specific" regions of nuclease activity by assessing where pAG-MNase is binding to IgG coated regions of the chromatin as a proxy for determining where the non-specific sequences are being cut across the genome. The number of reads associated with these regions in the IgG only sample (no target antibody) serves as a good model of our background or noise in the data. These regions are then modelled or "subtracted out" of the reads being called in the target regions in the same area to determine whether the peak signal we see in the target is real, resulting in a potentially biologically interesting find, or non-specific and therefore deemed biologically insiginificant or uninteresting and filtered out.
Analyzing your CUT&RUN data
Pipeline to generate counts
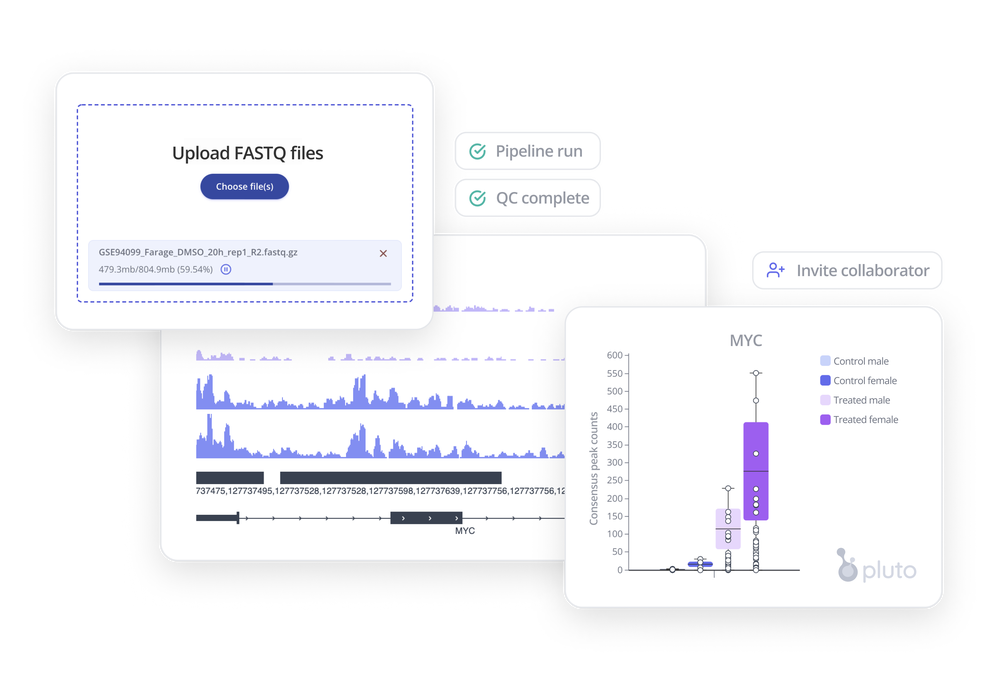
After you've prepared your samples and sent them off for sequencing, you'll receive FASTQ files. These large, raw sequencing files need to be processed through a multi-step CUT&RUN pipeline in order to ultimately generate consensus peak counts.
Common steps comprising a CUT&RUN pipeline (and some of the software used to perform them) include:
- Adapter trimming - TrimGalore!
- Alignment to target (and optionally spike-in) genomes - Bowtie 2
- Quality control (QC) - FASTQC and MultiQC
- Normalization to control or counts per million (CPM)
- Quality filter, sort and index alignments - samtools
- Mark (and optionally remove) duplicate reads - picard
- Create bedGraphs - bedtools
- Create bigWigs - bedGraphToBigWig
- Call peaks - SEACR or MACS2
- Count consensus peaks - subread featureCounts
Running the above tools yourself will require compute infrastructure and advanced coding. Expect the CUT&RUN pipeline to run in about 1-3 hours per sample depending on your compute resources and parallelization approach.
Want to get to insights faster? With Pluto, you can run an end-to-end CUT&RUN pipeline in your browser, with no infrastructure or coding required. Learn more with a live, 15-minute demo.
Analyses and visualization
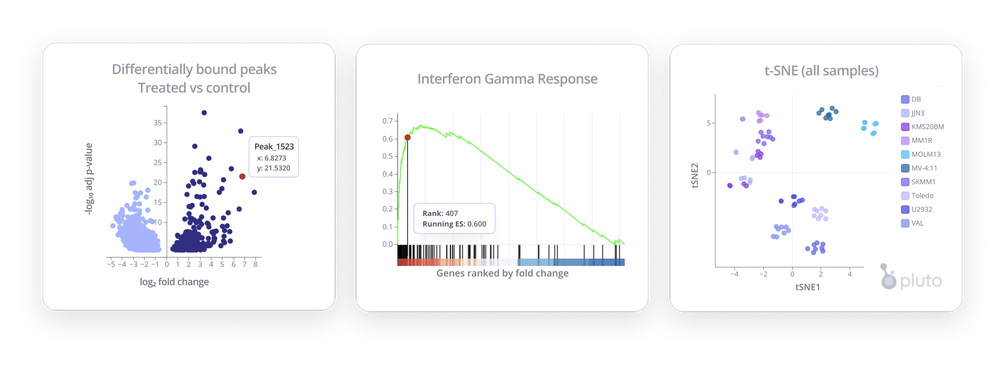
There are a wide variety of analyses and visualizations you can use to investigate your CUT&RUN data. Here are a few ideas to get you started doing data analysis!
- Differential binding analysis - Identify peak-level changes in DNA-protein binding between two groups
- Pathway analyses (GSEA) - Identify pathway-level changes
- Peak analysis - Scan across the genome to view peaks at loci of interest
- Dimensionality reduction analyses (PCA, UMAP, t-SNE) - Visualize how samples cluster on a scatterplot based on genome-wide binding
- Summary analysis - Plot consensus peak counts on bar plots, boxplots, line plots
Create all of these plots (and more!) in Pluto. Contact us to get started running bioinformatics analyses to create the interactive plots shown in this blog, all from your browser.
CUT&RUN Data Analysis
Analysing CUT&RUN data in your browser, without the need to manage pipelines can be a big win for your team. Allowing collaboration and agile discovery live in a meeting or presentation will transform how you iterate on your scientific research.
Ready to analyze some CUT&RUN?
Thanks for reading this brief overview of CUT&RUN experiments! To learn more about how your team can collaboratively analyze CUT&RUN data in your browser with Pluto, visit our website or our CUT&RUN page to get started today.
References & additional resources
- Skene, PJ and Henikoff, S. An efficient targeted nuclease strategy for high-resolution mapping of DNA binding sites. eLife 6:e21856 https://doi.org/10.7554/eLife.21856 (2017).
- Robertson G, et al. Genome-wide profiles of STAT1 DNA association using chromatin immunoprecipitation and massively parallel sequencing. Nat Methods 4:651-7; http://dx.doi.org/10.1038/nmeth1068 (2007)
- Kaya-Okur, HS, et al. CUT&Tag for efficient epigenomic profiling of small samples and single cells. Nature Communications 10 (2019).
- EpiCypher CUT&RUN brochure
- Cell Signaling Technologies CUT&RUN assay kit