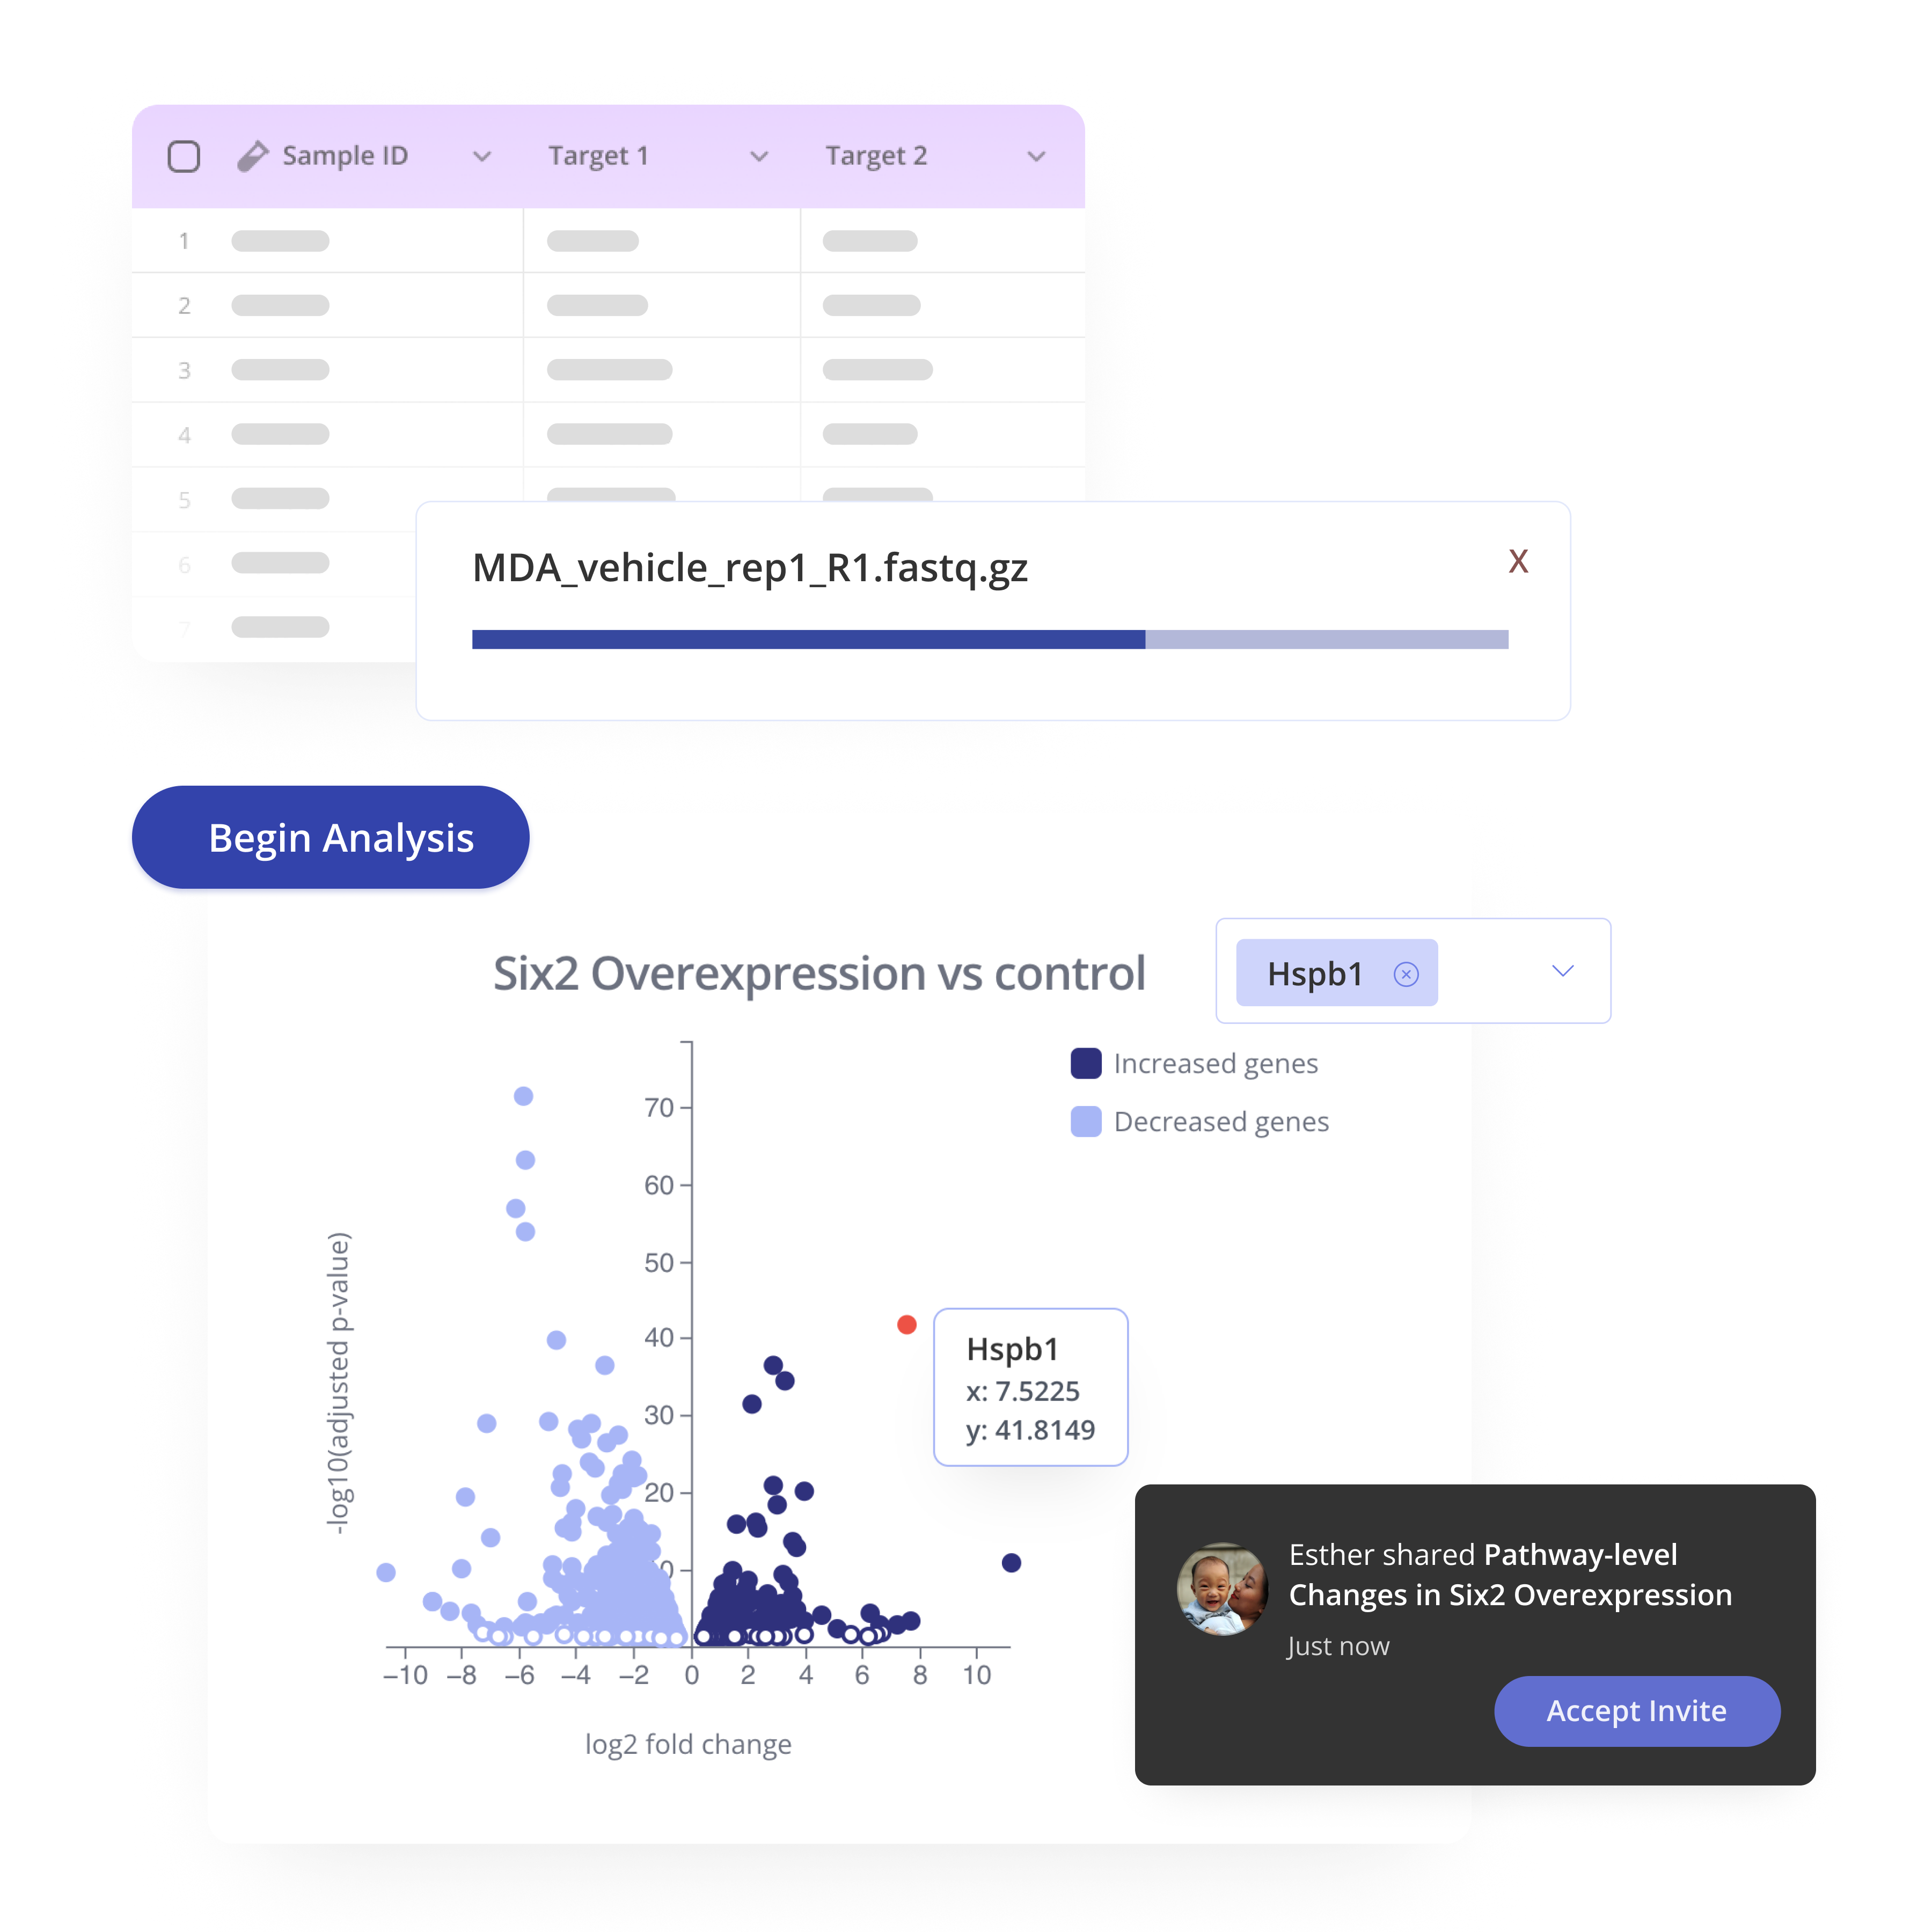
Interactive visualizations

Turn your raw data into presentation-ready plots by running bioinformatics analyses in your browser, with no coding required. Track every iteration, and customize to perfection. Pluto is bioinformatics figure-making software that actually saves your team time.

Get a demo
Hero graphic

Visualizations

When analyzing an experiment or data set in Pluto, plots can be added individually to the canvas and customized based on your unique experimental design. This gives users the freedom to explore and combine different combinations of visualizations to tell the story that's most relevant to the scientific questions being tested.

Bar plot & boxplot

Visualize raw or normalized data points in a wide variety of use cases and assays. Bar plots and boxplots look best when displaying a limited number of targets or groups of interest.

Scatterplot

Another foundational visualization component in biology, scatterplots are commonly used for PCA, tSNE, UMAP, and correlational analyses.

Volcano plot

Volcano plots are a special variant of the scatterplot used commonly in -omics and high-throughput assays. These plots typically show magnitude of change on the x-axis and statistical significance on the y-axis.

Heatmap

A matrix where the color gradient represents the value of each cell. Heatmaps can be hierarchically clustered on one or both axes, and labeled in various ways to explore relationships between entities being compared.

Kaplan-Meier curve

Investigate frequency and timing of events in patient populations with survival analysis, visualized on a Kaplan-Meier curve.

Line plot

Illustrate longitudinal trends across time, doses, or other ordered categories.

Enrichment plot

This unique style of graph originally created by the authors of Gene Set Enrichment Analysis displays an ordered list of genes annotated to a gene set and ranked by the desired statistic.

Top pathways

Explore the top most significant pathways across different biological conditions.

Integrative Genome Viewer (IGV) plot

Investigate specific regions across the entire genome. IGV plots allow you to map peaks to annotated regions in the genome of the organism being studied.

Tornado plot

Genome-wide heatmaps or tornado plots show peaks across the whole genome in one or more samples.

TSS profile plot

The transcription start site (TSS) is a common point of reference in epigenetics experiments measuring regions of binding or accessibility. Profile plots count up the reads maping in defined regions relative to the TSS.

Cluster plot

Often paired with a heatmap, clustering dendrograms show hirearchical relationships between samples based on similarity of their measured values (e.g. expression, binding).

Images

Showcase microscopy images, diagrams, and other image files alongside your data visualizations on the Pluto canvas.

Graphpad Prism figures

Graphpad Prism is a powerful tool for plotting and statistical analysis. Prism plots can be uploaded to the Pluto canvas as well, enabling collaborators to comment on them alongside Pluto-native visualizations.

Unlock insane productivity

Stop waiting weeks for results, instantly run the analyses you've been waiting for. Summarize raw and normalized values, run complex bioinformatics analyses intuitively in the browser. Hone in on consistent results - overlap two DEG lists. Store imaging results, upload figures from other programs, published papers. Plus, find any result in seconds, no more wasted time searching for plots - intuitively search by experiment, analysis, plot type, organism, date & more.

Explore analyses in Pluto

Dynamic results that keep pace as your science evolves

Create and customize biology-specific visualization from your results. Plots can be shared securely with live links that stay up to date, allowing your team to leave comments & notes about findings. Plots can also be live-embedded into electronic lab notebooks like Colabra, wikis in Sharepoint and Confluence, platforms like Benchling, and other tools your team uses to communicate science internally.

Figure-making software that actually saves your team time

Get a personalized
demo today

Let's talk discovery